Log In
Discover
Assets
Jobs
Behance
Pro
Hire Freelancers
Download on the App Store
Get it on Google Play
English
Čeština
Dansk
Deutsch
Español
Français
Italiano
Nederlands
Norsk
Polski
Português
Pусский
Suomi
Svenska
Türkçe
日本語
한국어
中文(简体)
中文(繁體)
About
Blog
TOU
Privacy
Community
Help
Do not sell or share my personal information
Sign Up
Skip to Main Content
Skip to Footer
Behance
Behance
Navigate to behance.net
Explore
Assets
Jobs
Behance
Pro
Hire Freelancers
search
magnifying glass
Sort & filter all:
Projects
Images
People
Assets
People to Hire
Cancel
search
magnifying glass
View your notifications within Behance.
View your notifications within Behance.
Log In
Sign Up
search
magnifying glass
Adobe, Inc.
Adobe, Inc.
Navigate to adobe.com
Follow
Unfollow
Follow
Following
Message
Add to Moodboard
Save
Share & Embed This Project
Share
Appreciate
Appreciate
Follow
Following
Unfollow
Follow
Unfollow
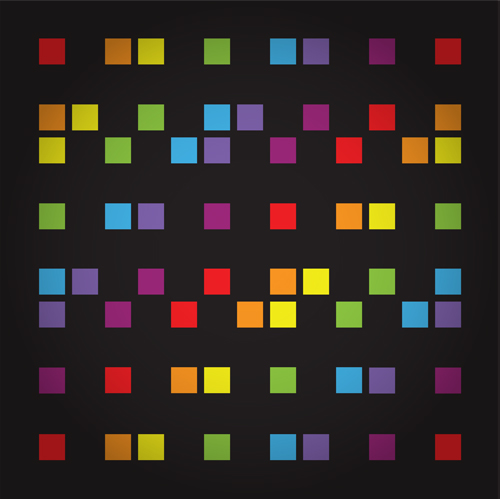
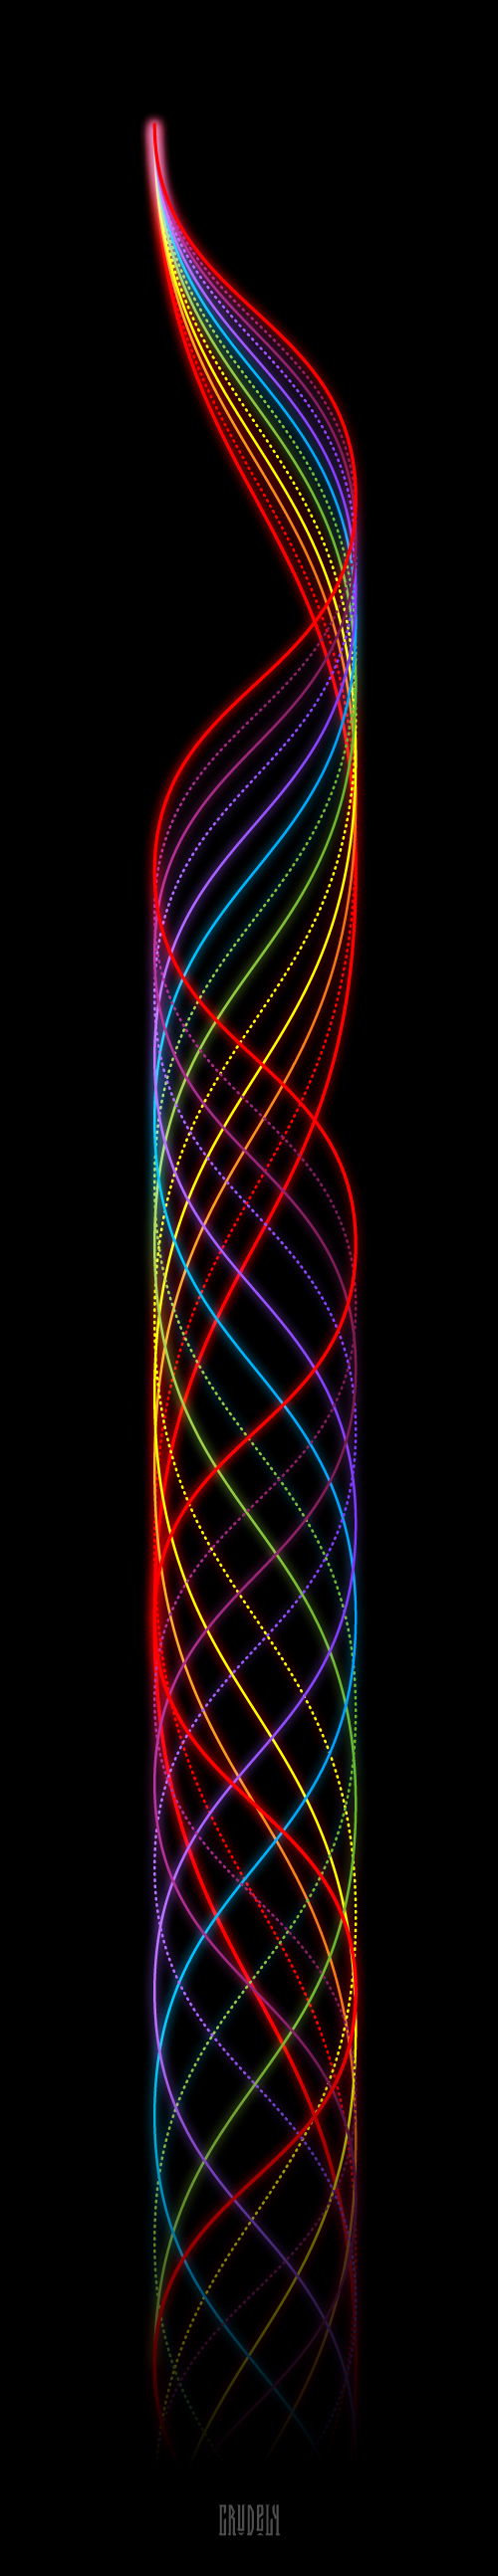
Visual interpretations of music
Richard Becker
•
Follow
Following
Unfollow
A = Red
B = Orange
C = Yellow
D = Green
E = Blue
F = Violet
G = Purple
Modes as squares:
Chromatic, modal & pentatonic spirals:
Fretboard of 5 string bass:
440 - 880 Hz semitonal wave forms:
Join Behance
Sign up
or
Sign in
to view personalized recommendations, follow creatives, and more.
Sign Up With Email
Sign Up
or
Join Behance
Sign up
or
Sign in
to view personalized recommendations, follow creatives, and more.
Sign Up With Email
Sign Up
or
Visual interpretations of music
18
746
0
Published:
August 23rd 2013
Richard Becker
Follow
Following
Unfollow
Owner
Richard Becker
Düsseldorf, Germany
Follow
Following
Unfollow
Message
Visual interpretations of music
Infographics created to get my head around musical theory.
18
746
0
Published:
August 23rd 2013
Creative Fields
Digital Art
Information Architecture
Music
Music Theory
Modes
scales
spiral
pentatonic
chromatic
waveforms
fretboard
spectrum
Copyright Info
Attribution, Non-commercial
Read More
Report